Bolt Torque Chart
Starting assembly torque for inch and metric bolts, dry and lubricated, in ft-lb, in-lb and N·m. Every number is calculated from T = K × D × F with the clamp load at 75% of proof load, so you can check it yourself.
The formula
T = K × D × F T = torque, K = nut factor (friction), D = nominal diameter, F = target clamp load. Here F = 75% of the proof load, and proof load = proof stress × tensile stress area. Worked example — 1/2-13 Grade 5, dry: 0.1419 in² × 85,000 psi = 12,062 lb proof; 75% = 9,046 lb; T = 0.20 × 0.500 × 9,046 = 905 in-lb = 75 ft-lb.K factor
| Condition | Typical K | Note |
|---|---|---|
| Plain steel, dry, as received | 0.20 | This chart’s dry column |
| Zinc plated, dry | 0.17 – 0.22 | Varies with plating and topcoat; many sealers add lubricity |
| Light machine oil | 0.15 – 0.18 | This chart’s lubricated column uses 0.15 |
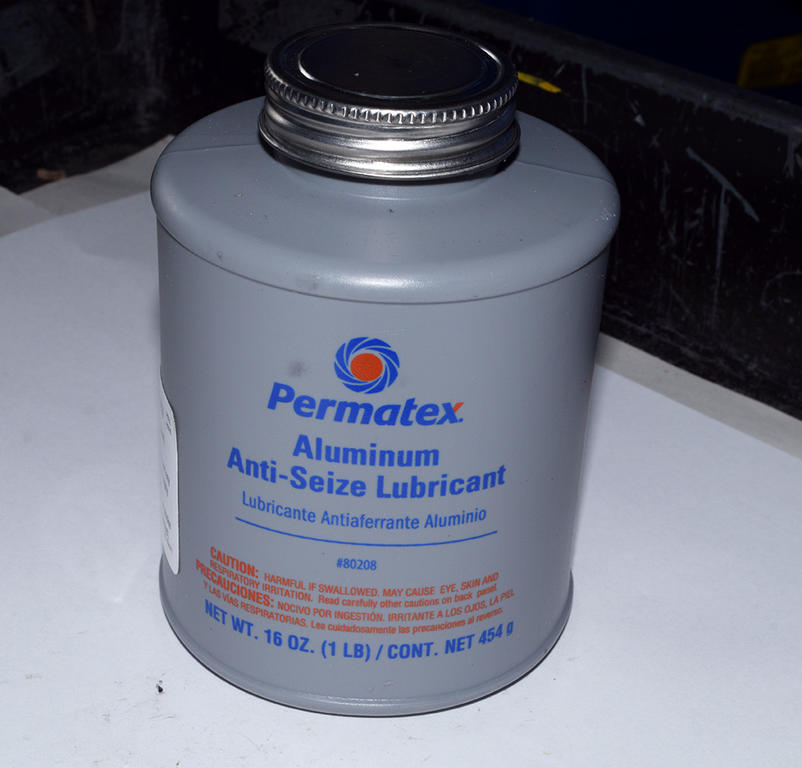
| Moly paste or anti-seize | 0.10 – 0.13 | Big drop — a dry value here can yield the bolt |
| Stainless on stainless, dry | 0.25 – 0.35 | Galling risk: use anti-seize and tighten slowly |
Typical ranges only. Actual K depends on finish, lubricant, washer, speed and even the batch — test critical joints.
Why torque charts disagree
Two honest charts can differ by 30% or more for the same bolt. The usual reasons: a different K (0.20 dry vs 0.15 oiled vs 0.18 zinc); a different clamp target (70%, 75% or 90% of proof); nominal area instead of tensile stress area; whether Grade 2 and Grade 5 step down at larger sizes; and rounding. This guide states every assumption on the page.
Even with the right chart, torque converts to actual preload with a scatter of about ±25–30%. The manufacturer’s or the drawing’s value always wins.