Proof Load vs Yield vs Tensile Strength

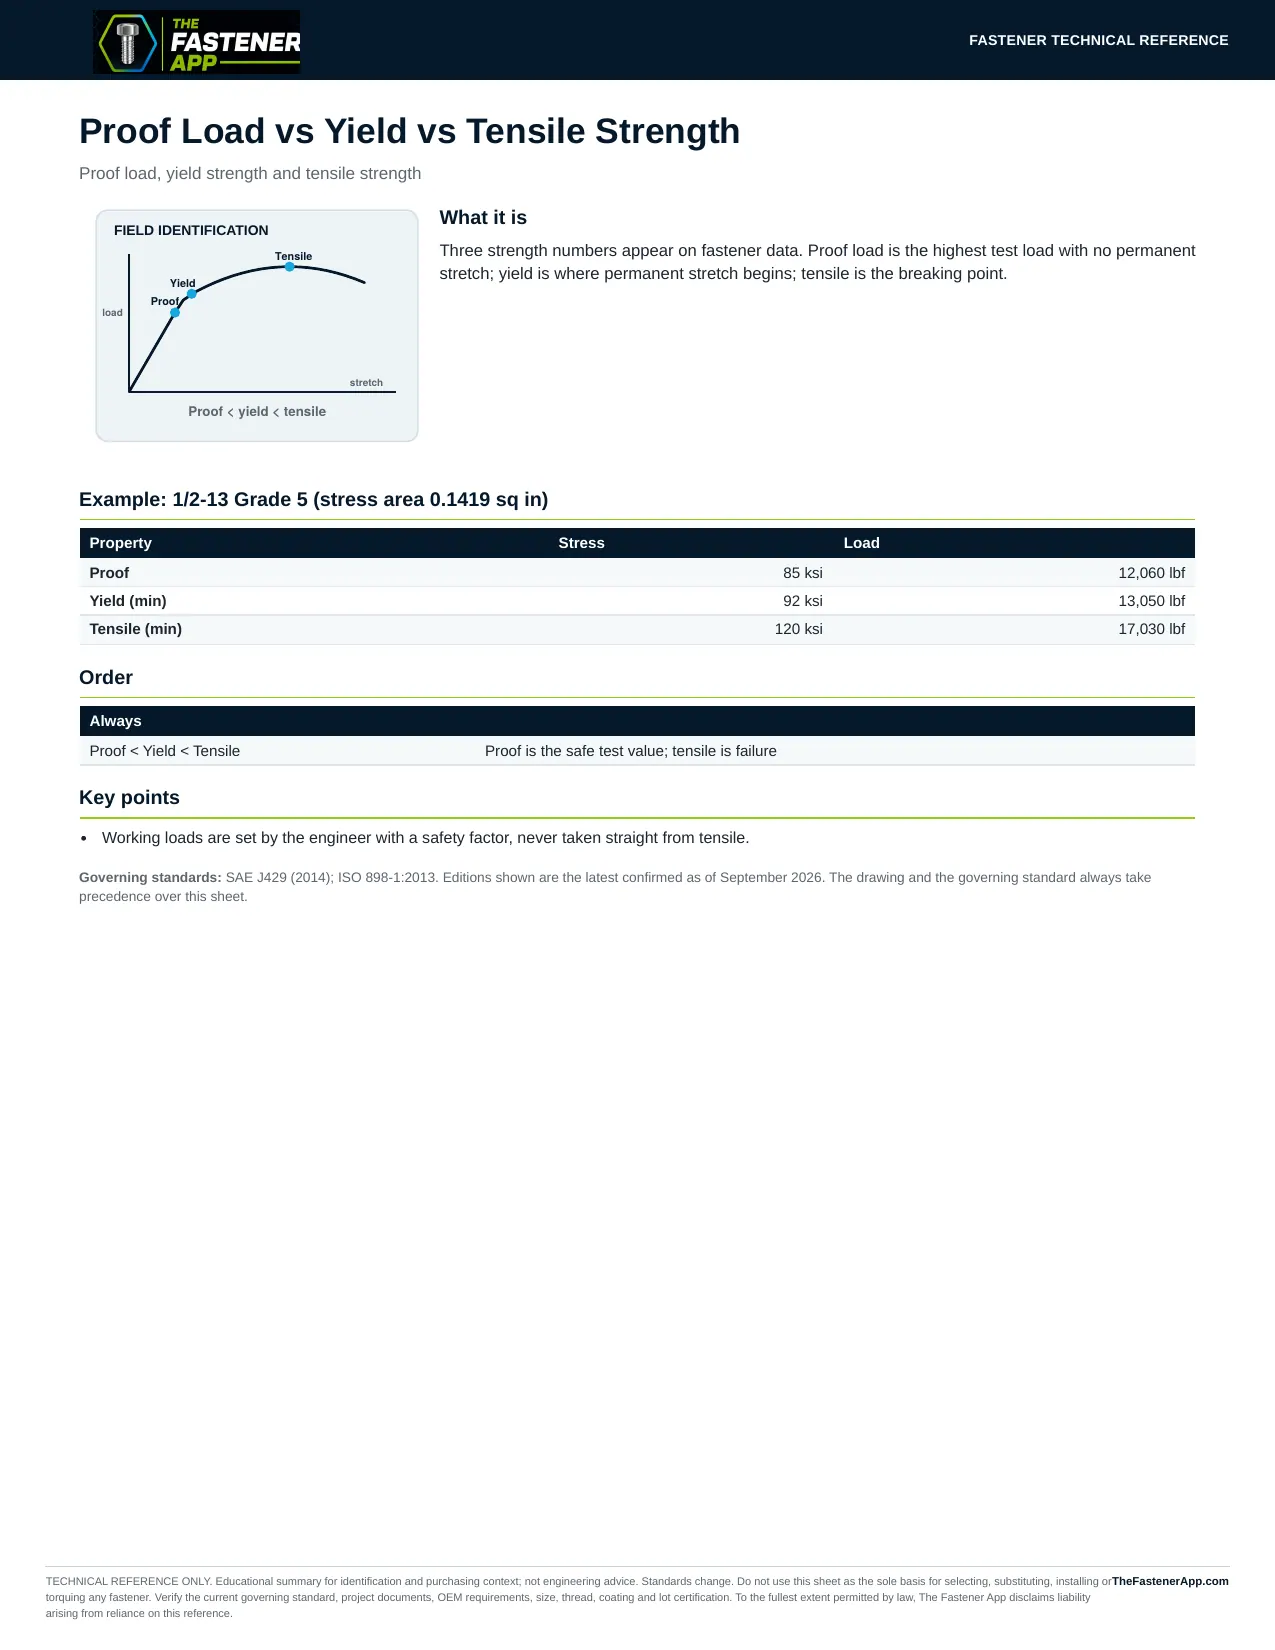
Three strength numbers appear on fastener data. Proof load is the highest test load with no permanent stretch; yield is where permanent stretch begins; tensile is the breaking point.

Last reviewed 2026-09-10 · Governing standard: SAE J429 (2014); ISO 898-1:2013 · reference FG-024ABE · Report an error on this sheet

Example: 1/2-13 Grade 5 (stress area 0.1419 sq in)

PropertyStressLoad
Proof85 ksi12,060 lbf
Yield (min)92 ksi13,050 lbf
Tensile (min)120 ksi17,030 lbf

Order

Always
Proof < Yield < TensileProof is the safe test value; tensile is failure

These tables carry the same figures as the printed sheet below.

The printed sheet
Proof Load vs Yield vs Tensile Strength

See an error on this sheet?

Tell us what is wrong.

Text version of this sheet

Proof load, yield strength and tensile strength

What it is

FIELD IDENTIFICATION

Three strength numbers appear on fastener data. Proof load is the highest test load with no permanent

stretch; yield is where permanent stretch begins; tensile is the breaking point.

Tensile

Yield

Proof

load

stretch

Proof < yield < tensile

Example: 1/2-13 Grade 5 (stress area 0.1419 sq in)

Property

Stress

Load

Proof

85 ksi

12,060 lbf

Yield (min)

92 ksi

13,050 lbf

Tensile (min)

120 ksi

17,030 lbf

Order

Always

Proof < Yield < Tensile

Proof is the safe test value; tensile is failure

Key points

Working loads are set by the engineer with a safety factor, never taken straight from tensile.

Governing standards: SAE J429 (2014); ISO 898-1:2013. Editions shown are the latest confirmed as of September 2026. The drawing and the governing standard always take

precedence over this sheet.

torquing any fastener. Verify the current governing standard, project documents, OEM requirements, size, thread, coating and lot certification. To the fullest extent permitted by law, The Fastener App disclaims liability

arising from reliance on this reference.

Fastener Guide reference FG-024ABE · thefastenerapp.com/fastener-guide/technical-reference/proof-load-vs-yield-vs-tensile-strength · © The Fastener App. Reference only — verify the current governing standard, drawing and manufacturer data before specifying or installing.
Scan the label, the item lands in the shopping cart

Your rep or the customer scans a barcode label or they can select items from your store. No part number to remember, no phone call to your counter, no one re-keying anything.

  • Built into the app, not a separate device or an add-on
  • Works on any phone camera, or a handheld scanner if they have one
  • Scans your competitors’ barcode labels too*
  • Customers and employees can place orders 24 hours a day, even after hours, and the orders will be waiting for you when you get there in the morning. You can choose to be notified every time an order is placed, whether you’re at the office or not. It gives you greater visibility into your company’s ordering activity.

* Simply cross the number in the system to ours, and we can walk you through the process.

See what every customer buys from you

Every account gets a category chart: share of dollars, share of times ordered and share of pieces. Your reps see what each customer buys from you, and the categories they are buying somewhere else stand out.

Share of dollars

Fasteners37%$69,879
Electrical10%$19,152
Fleet and Automotive7%$12,293
Hardware and Building Supplies5%$10,243
Tools and Equipment5%$9,811
Cutting Tools and Metalworking5%$9,740
Plumbing5%$8,865
All other25%$46,410

Share of times ordered

Fasteners44%355
Electrical12%94
Fleet and Automotive7%53
Tools and Equipment6%48
Cutting Tools and Metalworking4%36
Pneumatics4%34
Hardware and Building Supplies4%33
All other20%162

Share of pieces

Fasteners75%486,316
Fleet and Automotive6%38,905
Electrical5%31,100
Hardware and Building Supplies3%19,775
Sealing3%17,704
Abrasives3%17,251
General MRO2%16,133
All other4%23,770

Sample report from our demo store.

Sales rep territory management

The time planner splits each rep’s month by how much every customer spends. A customer that is 20% of the rep’s business gets about 35 hours a month, about 8 hours a week, and the rep’s week is laid out for them.

Share of the rep’s business

Summit Precast LLC20.2%
Brunswick Galvanizing Inc.14.6%
Talleyrand Signs LLC8.0%
Mayport Tool & Die Inc.7.8%
Eagle Mechanical LLC7.2%
Premier Electric Group5.9%
Tallahassee Packaging LLC3.7%
Coastal Maintenance Group3.3%
All others (64 customers)29.4%

Time each customer deserves

CustomerHours a monthHours a week
Summit Precast LLC35.08.1
Brunswick Galvanizing Inc.25.35.8
Talleyrand Signs LLC13.93.2
Mayport Tool & Die Inc.13.53.1
Eagle Mechanical LLC12.52.9
Premier Electric Group10.22.4
Tallahassee Packaging LLC6.41.5
Coastal Maintenance Group5.71.3
All others (64 customers)51.011.8

Sample plan from our demo store: 173 hours a month, all selling time.

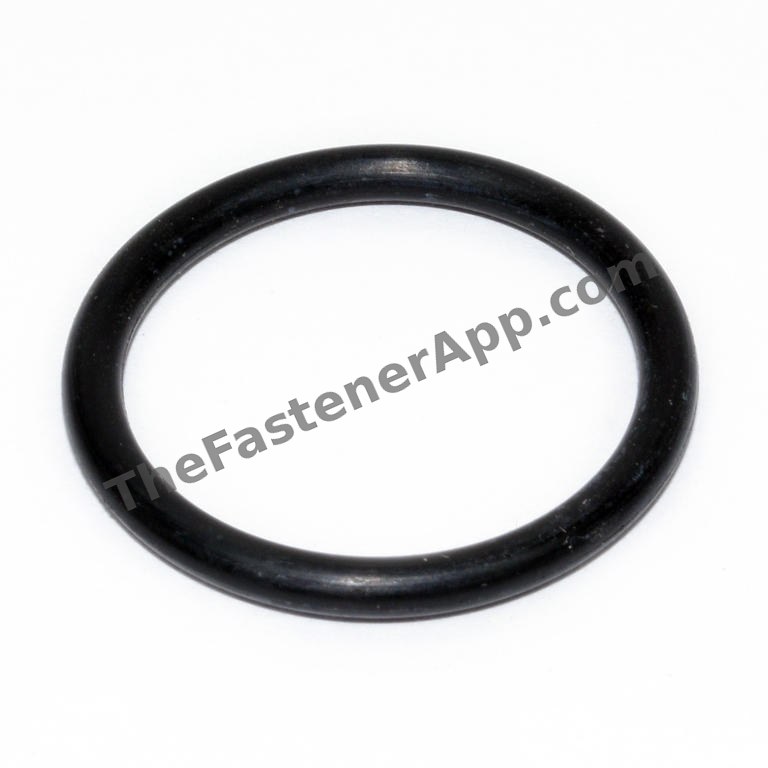
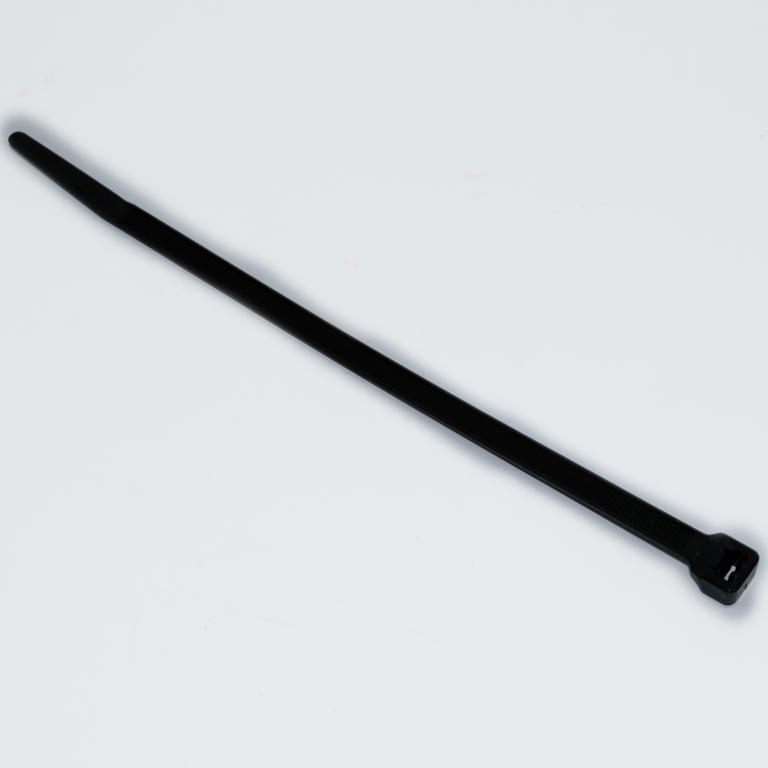
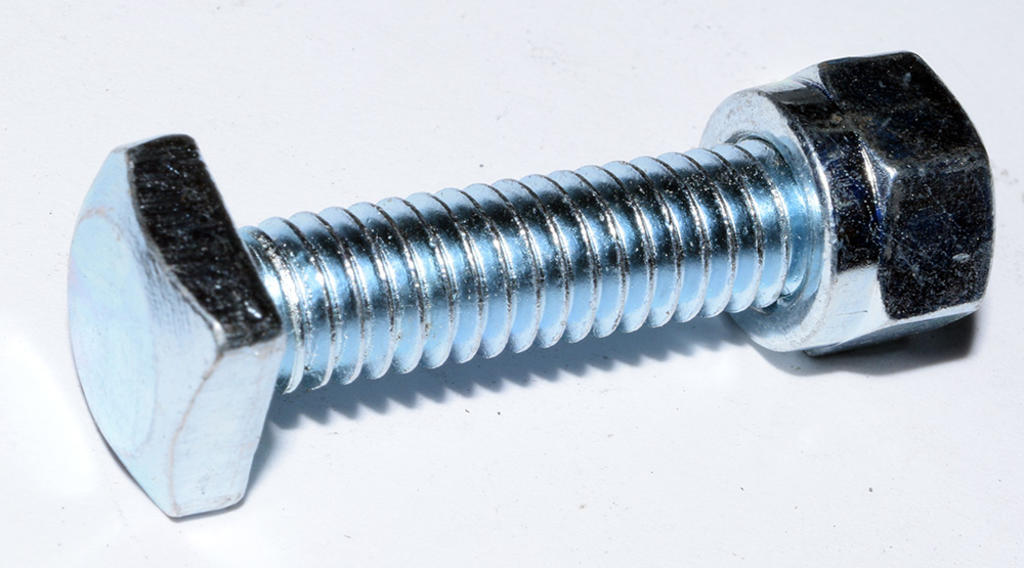
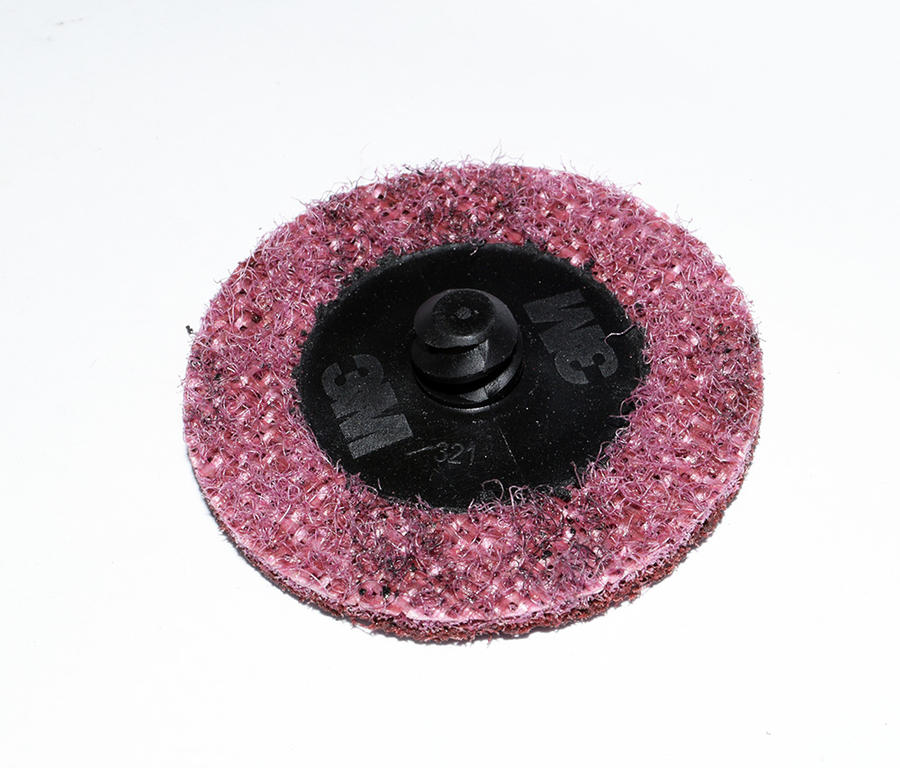
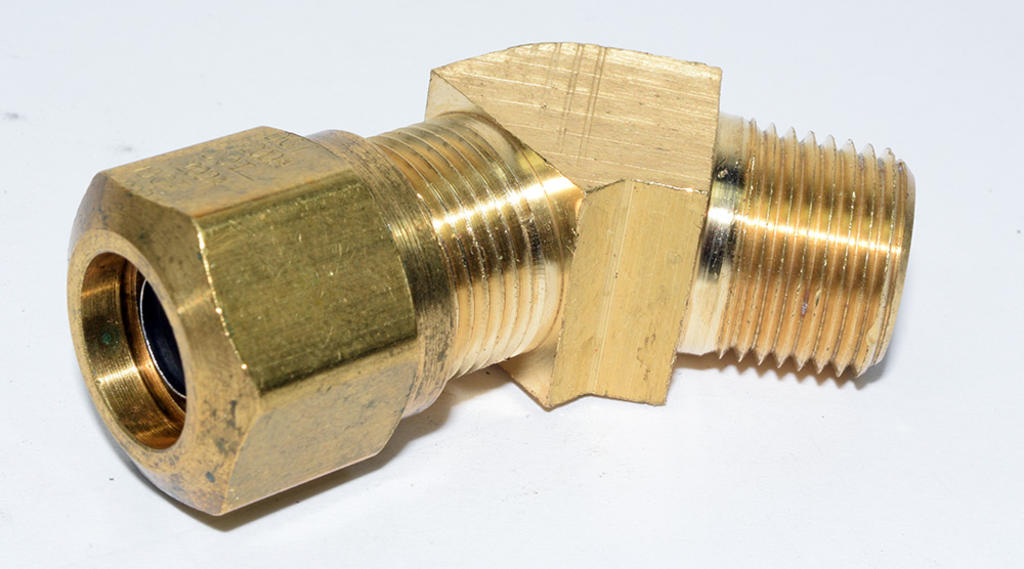
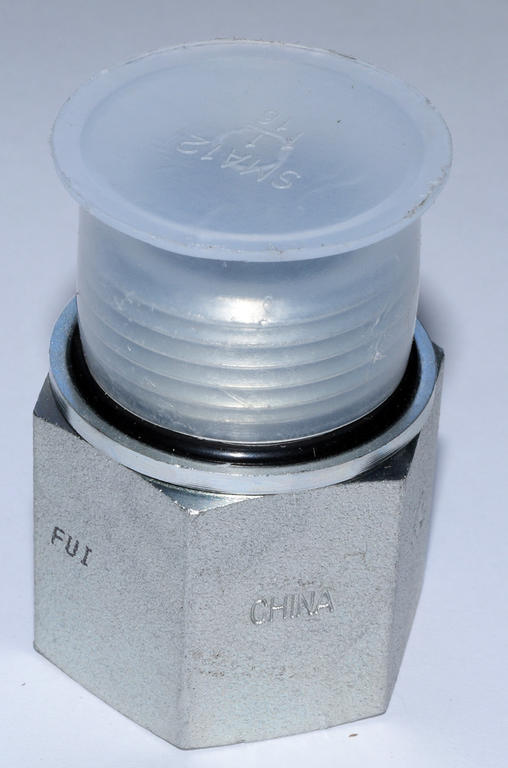
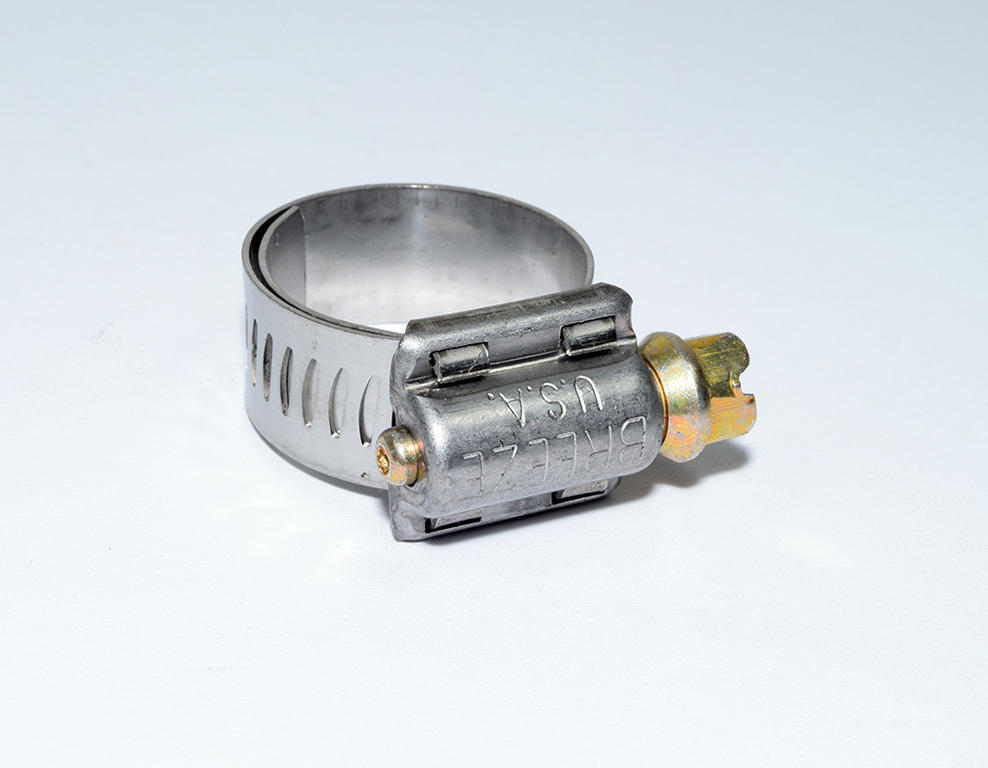
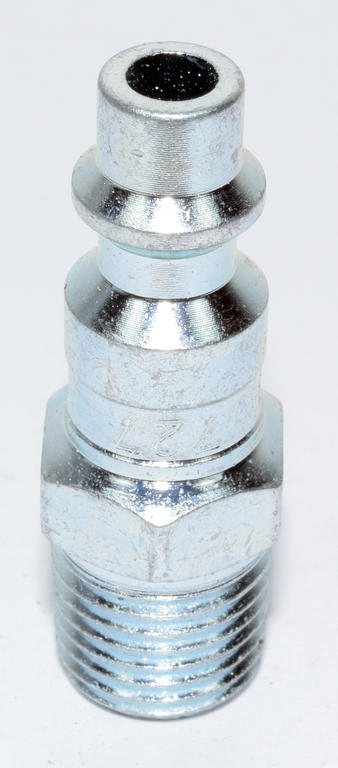
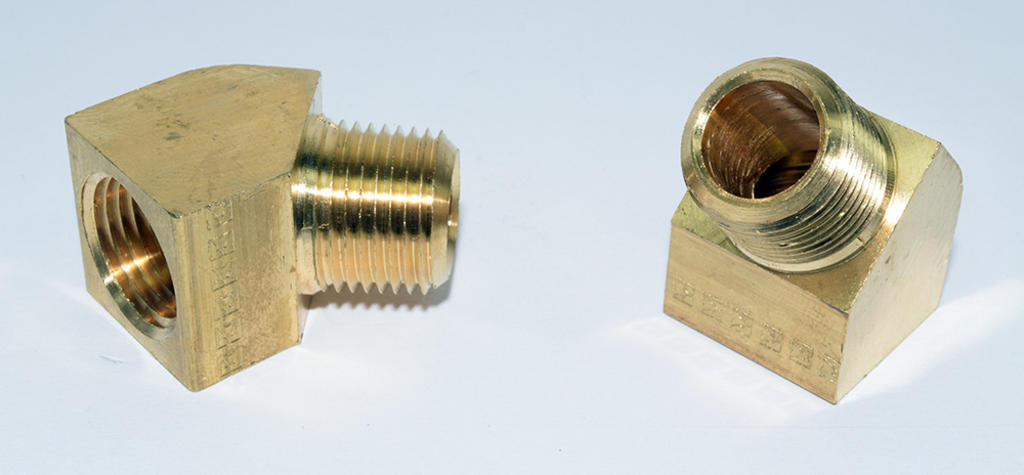
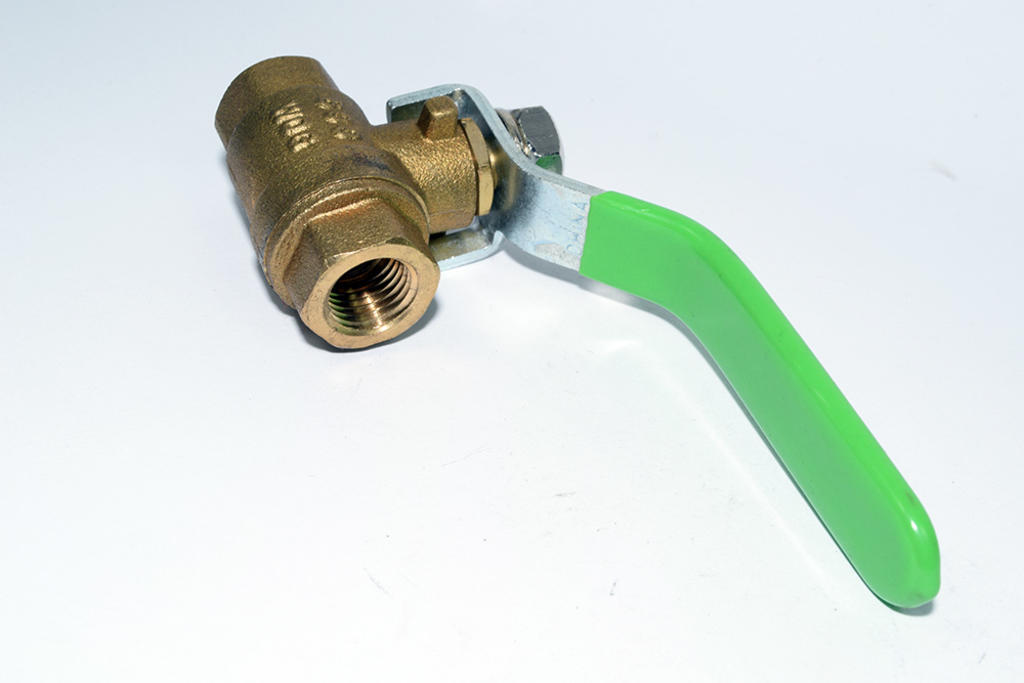
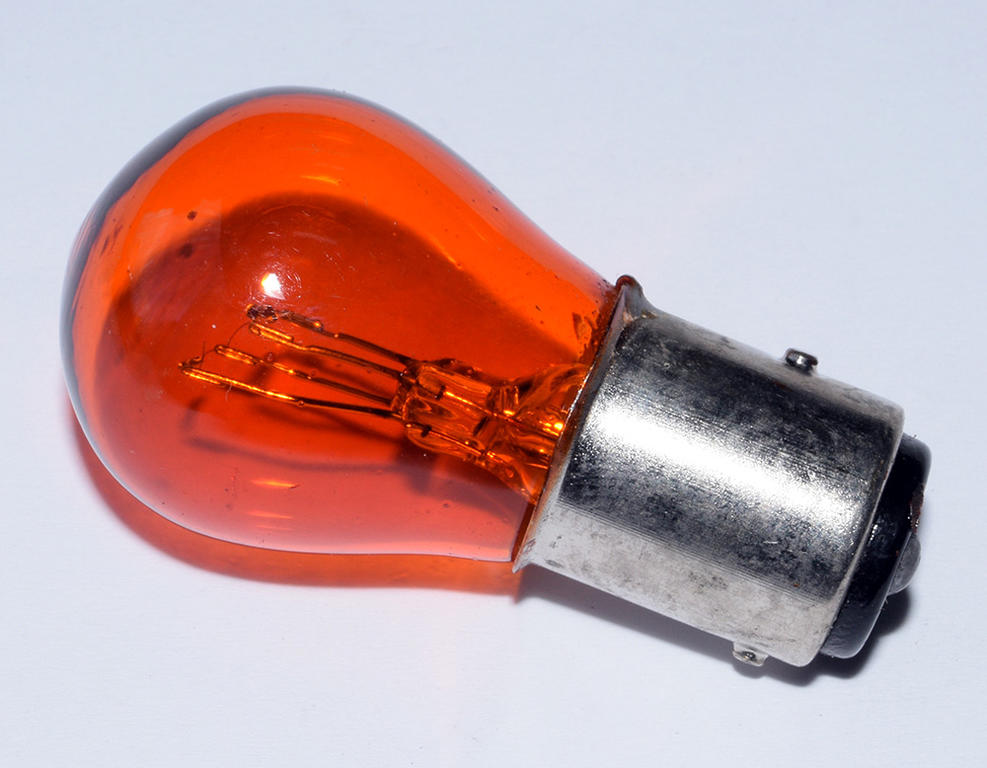
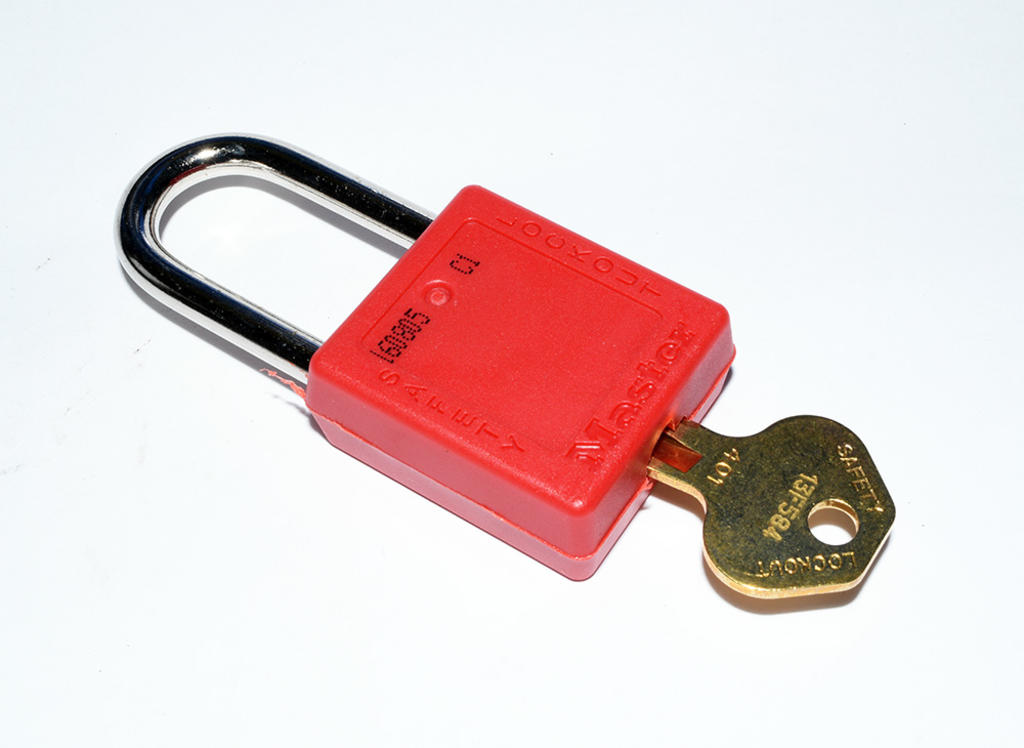
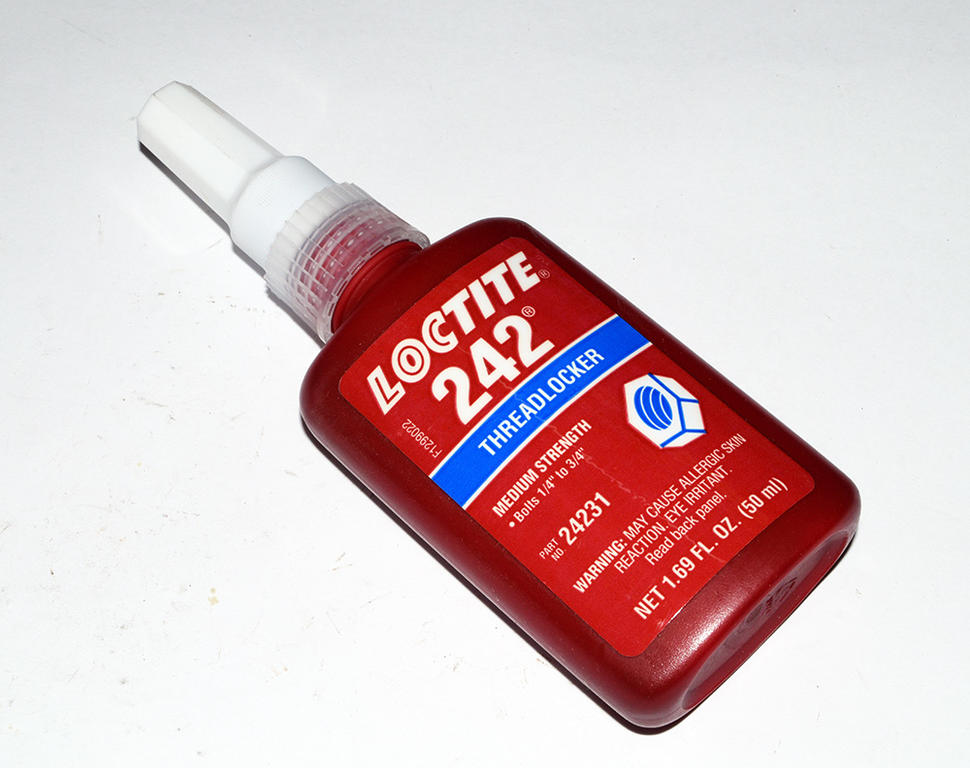
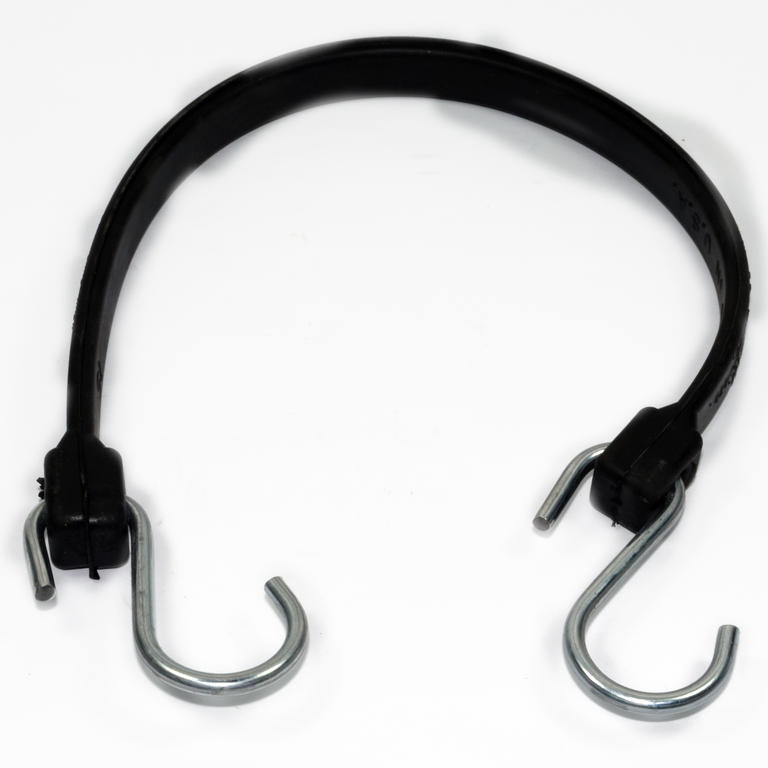
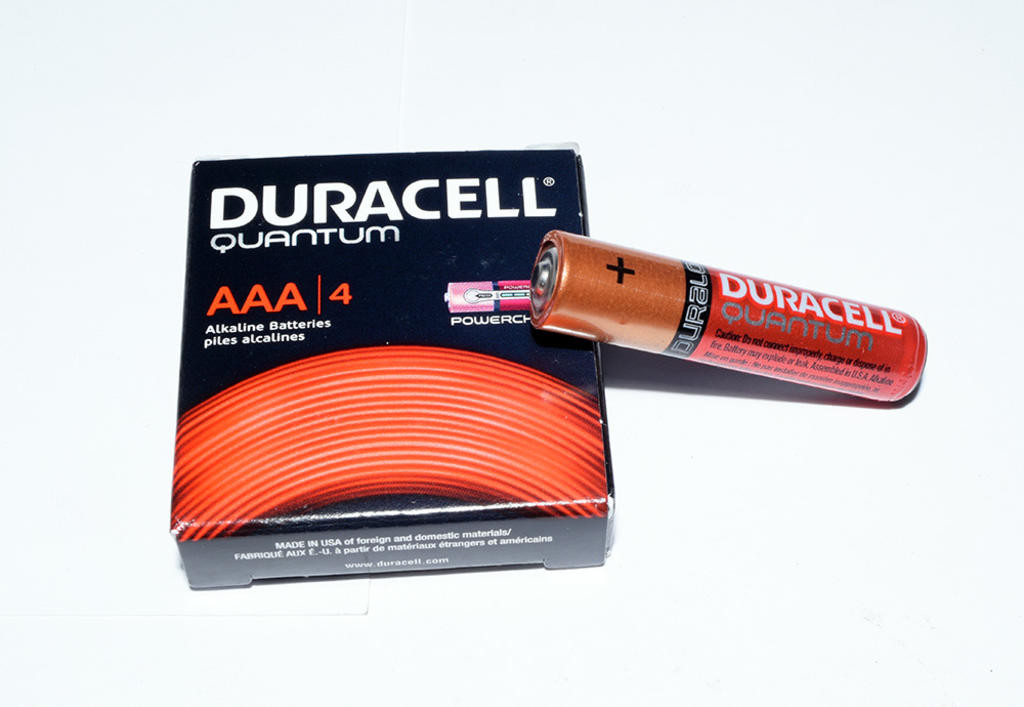
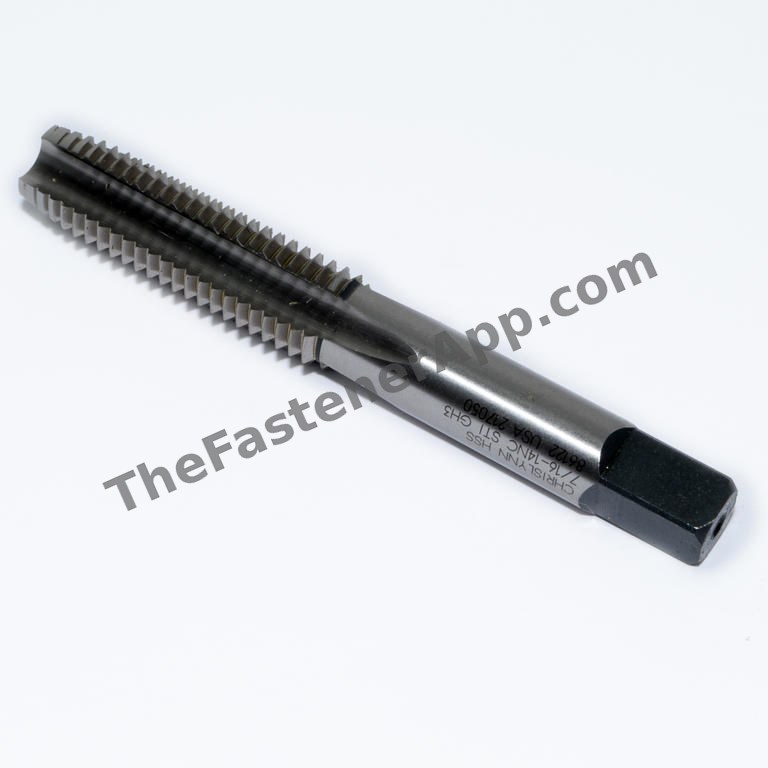
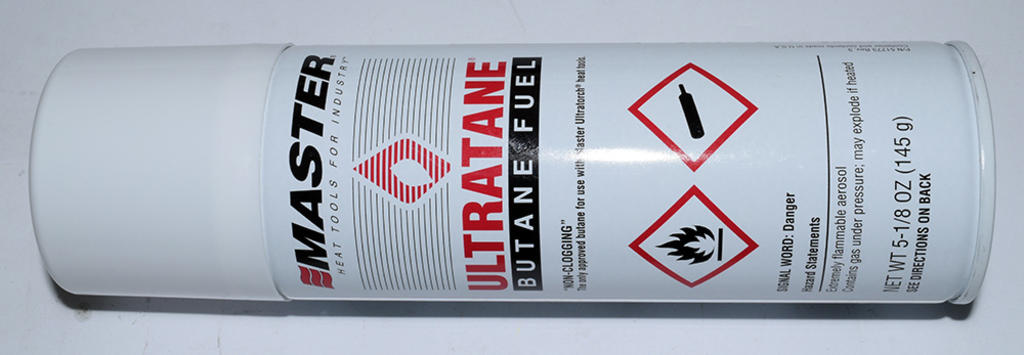
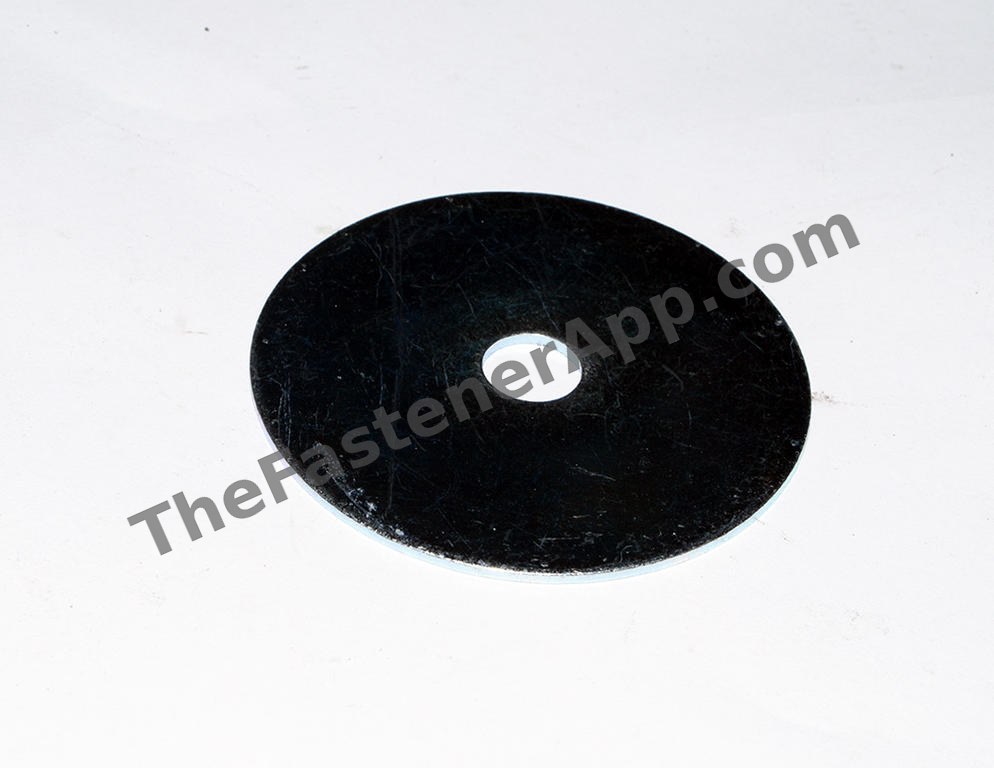
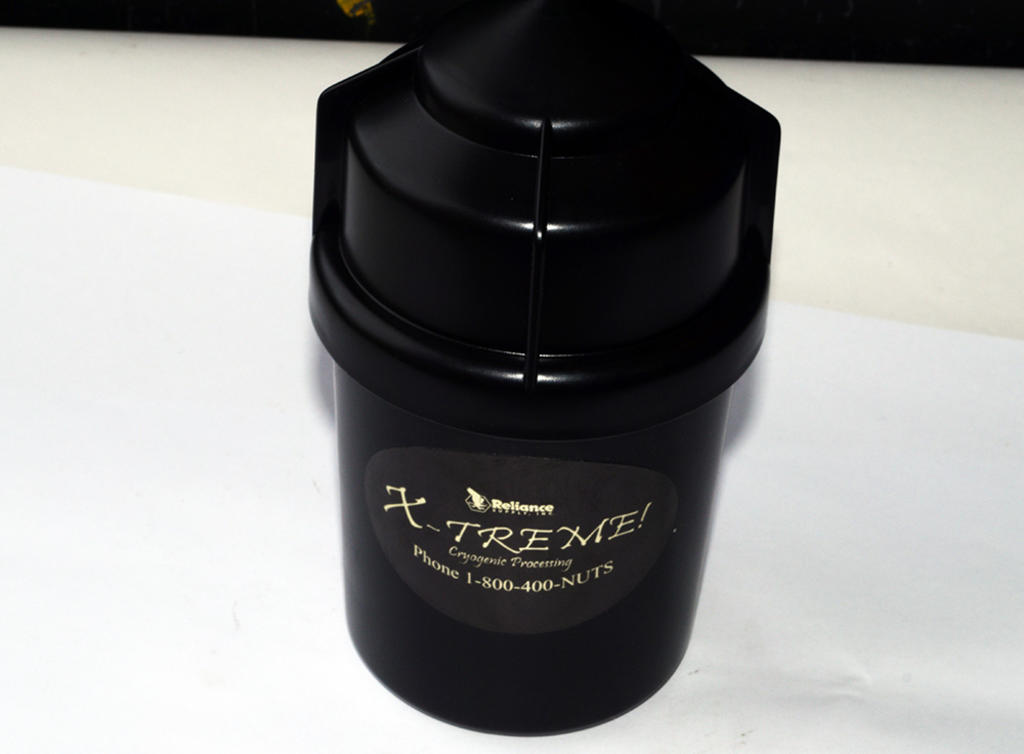
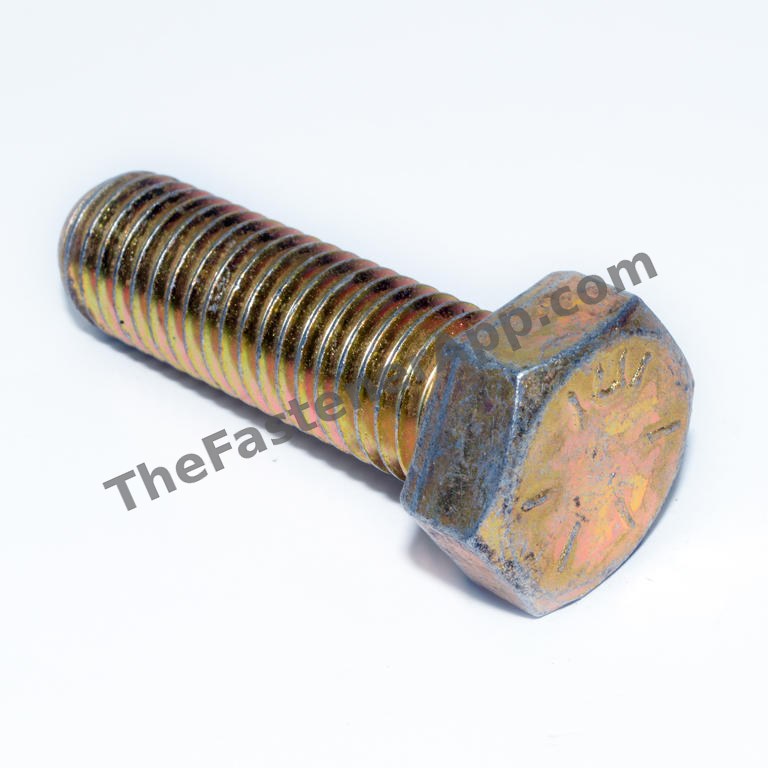
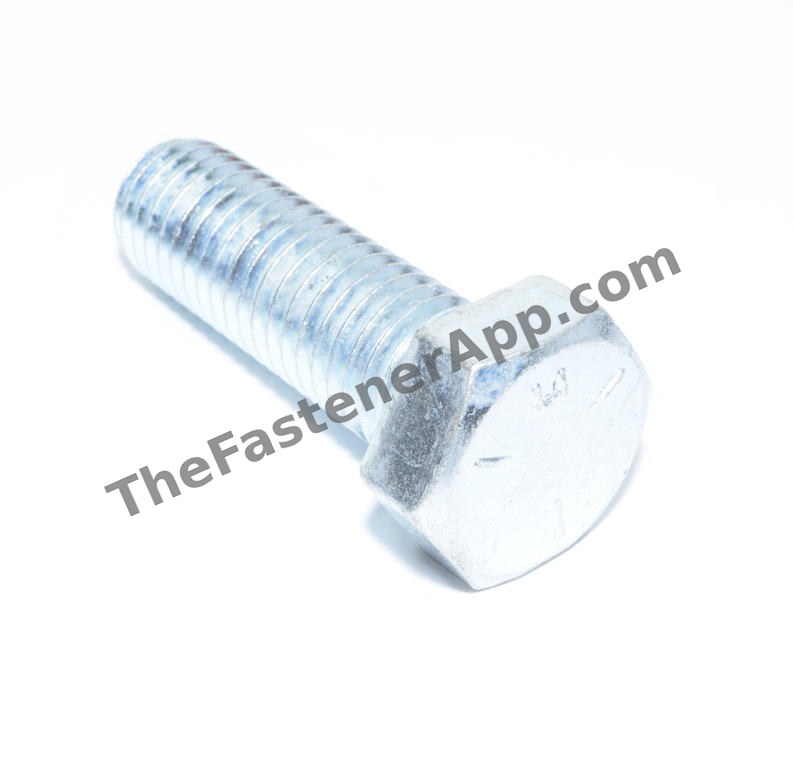
Nearly 3,000 real product photographs, covering more than 27,000 SKUs.

We had a professional photographer come in and spend weeks in our warehouse, photographing and producing real, high-resolution photos of many of our products. This work is ongoing, and many more products will be added. Right now the photographs cover more than 27,000 SKUs. We also have AI image generation capabilities.

Not ready yet? Send yourself the details.

Leave your email and we will send you what your own store would look like, what it costs, and what we would need from your system. No call unless you ask for one.

Or call 904-422-1273. We never sell or share your details.