#33 FASTENER VMI / AUTOMATION SYSTEMS

Printable shop wall chart: #33 FASTENER VMI / AUTOMATION SYSTEMS. Free letter-size PDF to print and post at the counter; 25 x 36 inch poster version available.

Last reviewed 2026-09-10 · reference FG-A35A2C · Report an error on this sheet

SystemHow it signalsBest for
Two-bin kanbanEmpty binMost fasteners at point of use
Bar code / QR scanLabel scanRoute-serviced bins
RFIDTag read, no line of sightHigh-volume sites
Weight scaleWeight to countContinuous monitoring
Industrial vendingDispense by userHigher-value MRO
ConsignmentUsage reportsKeeping inventory off the books
KittingKit per jobHigh-mix assembly

Common KPIs

KPIDefinition
Fill ratePercent of bins filled when serviced
StockoutsNumber of empty bins or line stops
Inventory valueDollars on hand at site
TurnsAnnual usage / average inventory
On-time servicePercent of scheduled visits completed
SavingsDocumented cost reductions

Pick the simplest system that gives a reliable signal. Integrate orders, shipments and invoices by EDI (850 / 855 / 856 / 810).

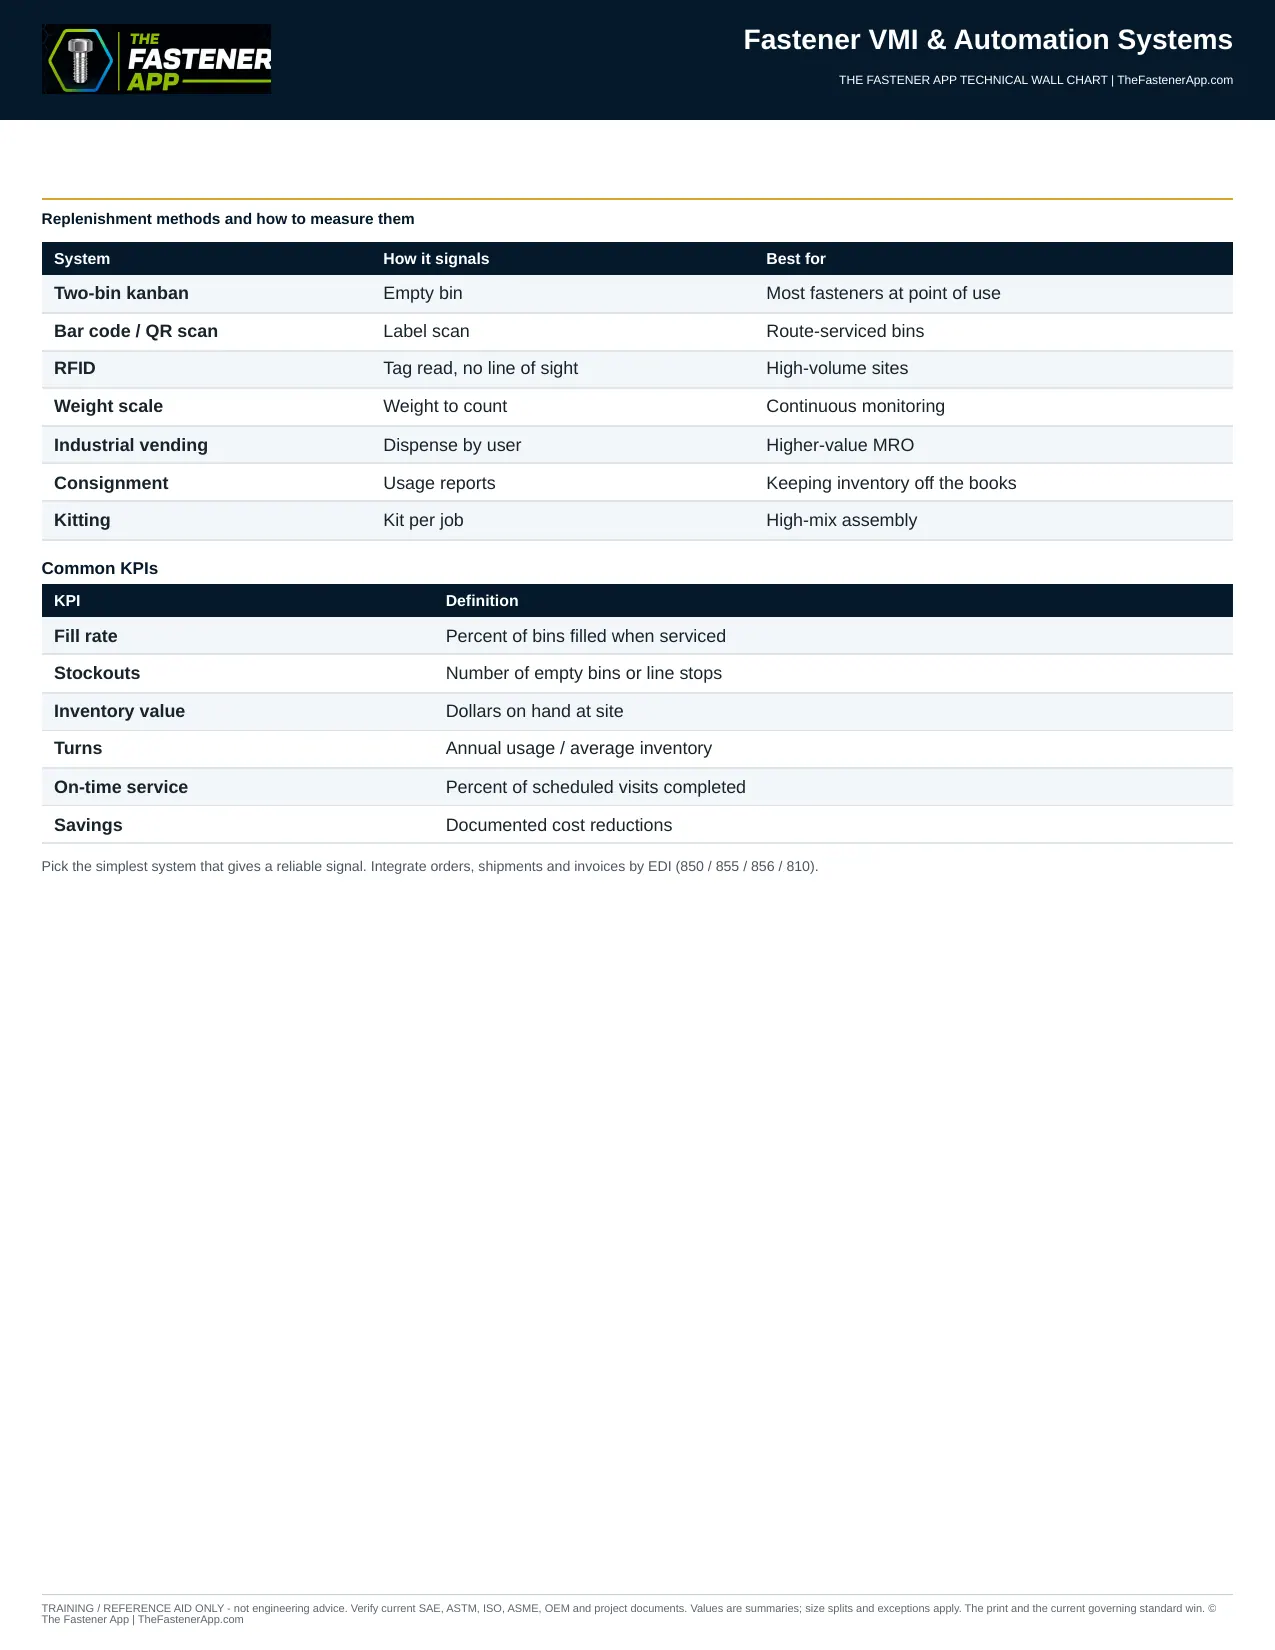
These tables carry the same figures as the printed sheet below.

The printed sheet
#33 FASTENER VMI / AUTOMATION SYSTEMS

25 x 36 inch poster version

For the full-size shop poster, tell us where to send it.

See an error on this sheet?

Tell us what is wrong.

Text version of this sheet

Fastener VMI & Automation Systems

Replenishment methods and how to measure them

System

How it signals

Best for

Two-bin kanban

Empty bin

Most fasteners at point of use

Bar code / QR scan

Label scan

Route-serviced bins

RFID

Tag read, no line of sight

High-volume sites

Weight scale

Weight to count

Continuous monitoring

Industrial vending

Dispense by user

Higher-value MRO

Consignment

Usage reports

Keeping inventory off the books

Kitting

Kit per job

High-mix assembly

Common KPIs

KPI

Definition

Fill rate

Percent of bins filled when serviced

Stockouts

Number of empty bins or line stops

Inventory value

Dollars on hand at site

Turns

Annual usage / average inventory

On-time service

Percent of scheduled visits completed

Savings

Documented cost reductions

Pick the simplest system that gives a reliable signal. Integrate orders, shipments and invoices by EDI (850 / 855 / 856 / 810).

The Fastener App | TheFastenerApp.com

Fastener Guide reference FG-A35A2C · thefastenerapp.com/fastener-guide/wall-charts/33-fastener-vmi-automation-systems · © The Fastener App. Reference only — verify the current governing standard, drawing and manufacturer data before specifying or installing.
Scan the label, the item lands in the shopping cart

Your rep or the customer scans a barcode label or they can select items from your store. No part number to remember, no phone call to your counter, no one re-keying anything.

  • Built into the app, not a separate device or an add-on
  • Works on any phone camera, or a handheld scanner if they have one
  • Scans your competitors’ barcode labels too*
  • Customers and employees can place orders 24 hours a day, even after hours, and the orders will be waiting for you when you get there in the morning. You can choose to be notified every time an order is placed, whether you’re at the office or not. It gives you greater visibility into your company’s ordering activity.

* Simply cross the number in the system to ours, and we can walk you through the process.

See what every customer buys from you

Every account gets a category chart: share of dollars, share of times ordered and share of pieces. Your reps see what each customer buys from you, and the categories they are buying somewhere else stand out.

Share of dollars

Fasteners37%$69,879
Electrical10%$19,152
Fleet and Automotive7%$12,293
Hardware and Building Supplies5%$10,243
Tools and Equipment5%$9,811
Cutting Tools and Metalworking5%$9,740
Plumbing5%$8,865
All other25%$46,410

Share of times ordered

Fasteners44%355
Electrical12%94
Fleet and Automotive7%53
Tools and Equipment6%48
Cutting Tools and Metalworking4%36
Pneumatics4%34
Hardware and Building Supplies4%33
All other20%162

Share of pieces

Fasteners75%486,316
Fleet and Automotive6%38,905
Electrical5%31,100
Hardware and Building Supplies3%19,775
Sealing3%17,704
Abrasives3%17,251
General MRO2%16,133
All other4%23,770

Sample report from our demo store.

Sales rep territory management

The time planner splits each rep’s month by how much every customer spends. A customer that is 20% of the rep’s business gets about 35 hours a month, about 8 hours a week, and the rep’s week is laid out for them.

Share of the rep’s business

Summit Precast LLC20.2%
Brunswick Galvanizing Inc.14.6%
Talleyrand Signs LLC8.0%
Mayport Tool & Die Inc.7.8%
Eagle Mechanical LLC7.2%
Premier Electric Group5.9%
Tallahassee Packaging LLC3.7%
Coastal Maintenance Group3.3%
All others (64 customers)29.4%

Time each customer deserves

CustomerHours a monthHours a week
Summit Precast LLC35.08.1
Brunswick Galvanizing Inc.25.35.8
Talleyrand Signs LLC13.93.2
Mayport Tool & Die Inc.13.53.1
Eagle Mechanical LLC12.52.9
Premier Electric Group10.22.4
Tallahassee Packaging LLC6.41.5
Coastal Maintenance Group5.71.3
All others (64 customers)51.011.8

Sample plan from our demo store: 173 hours a month, all selling time.

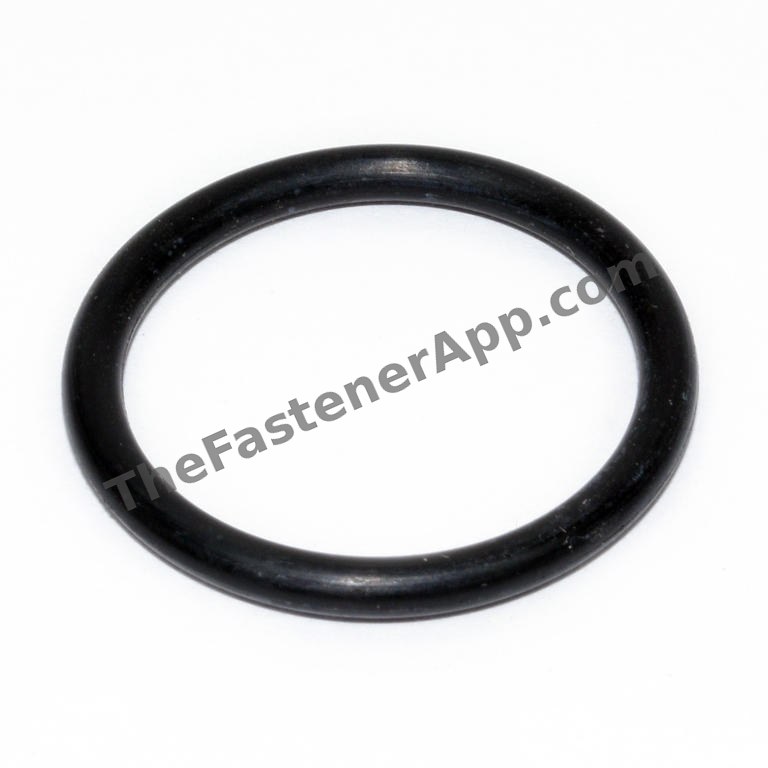
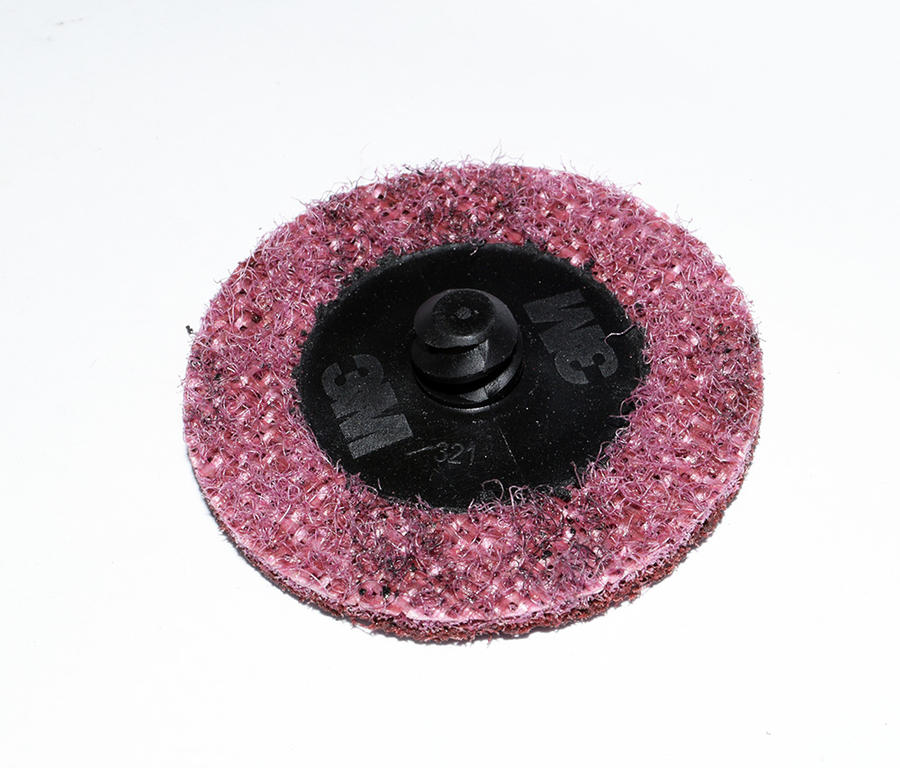
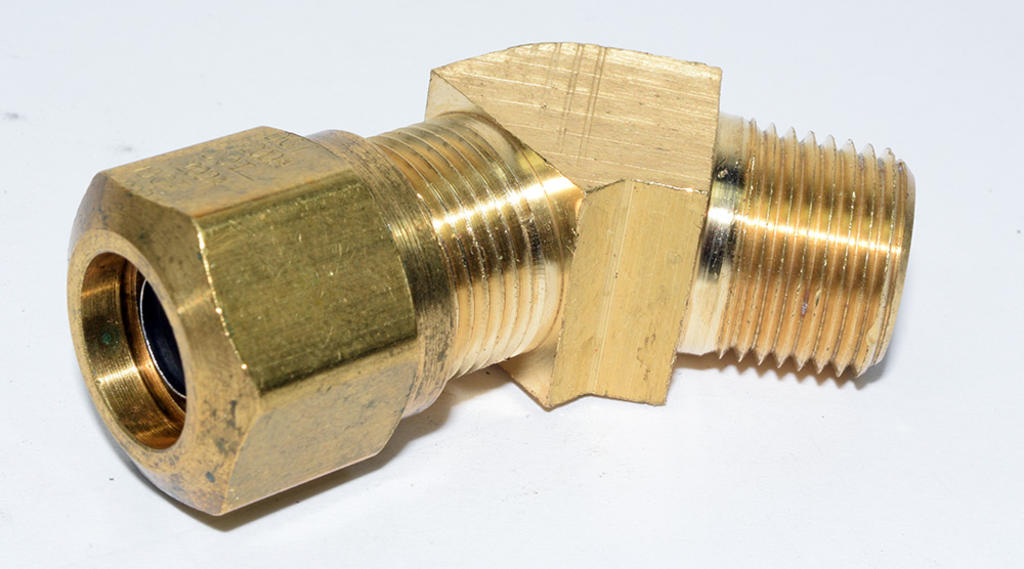
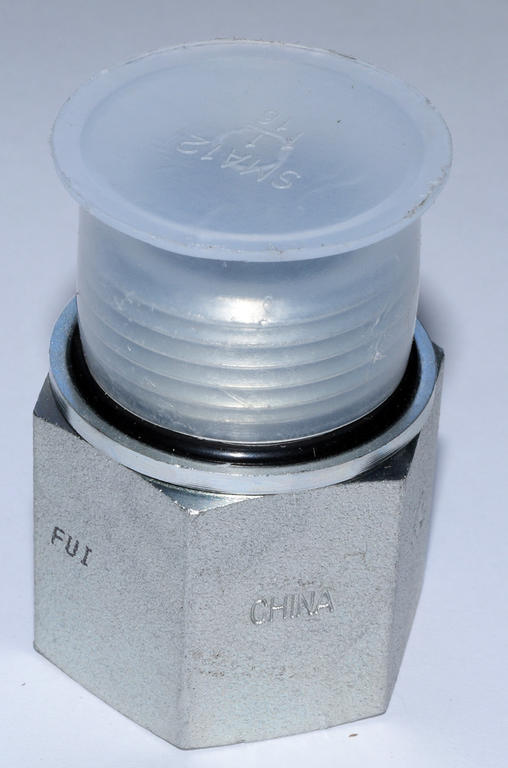
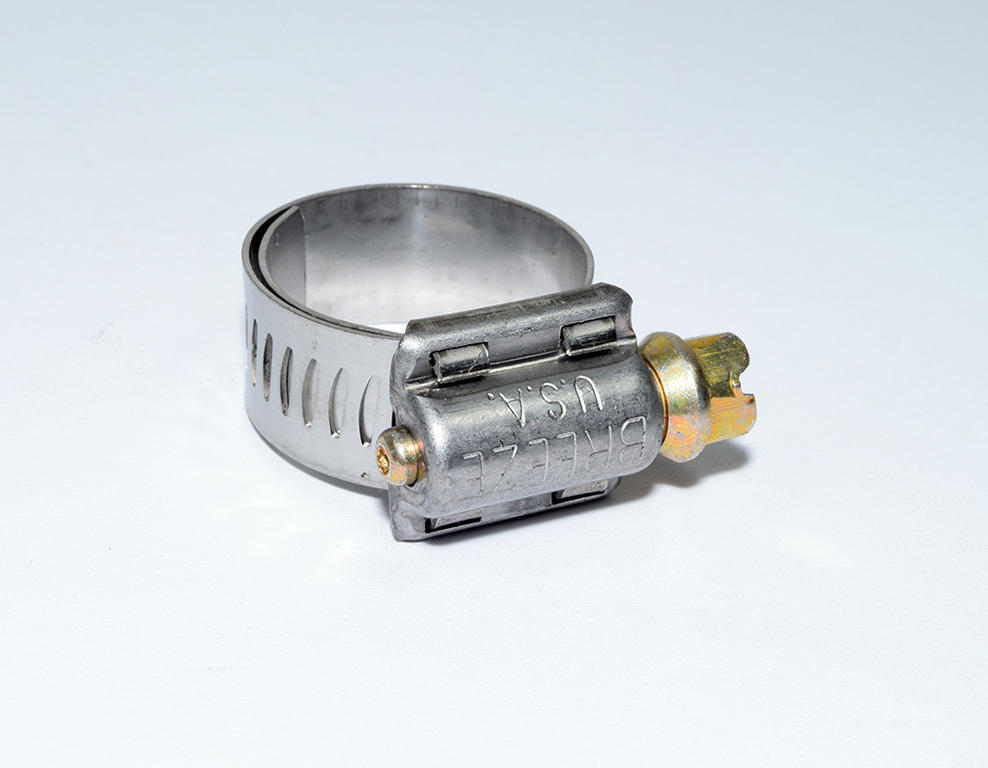
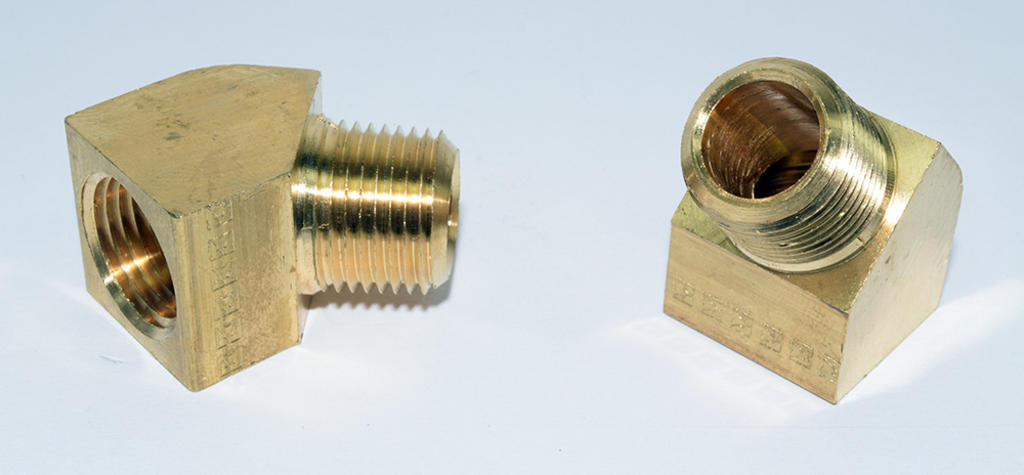
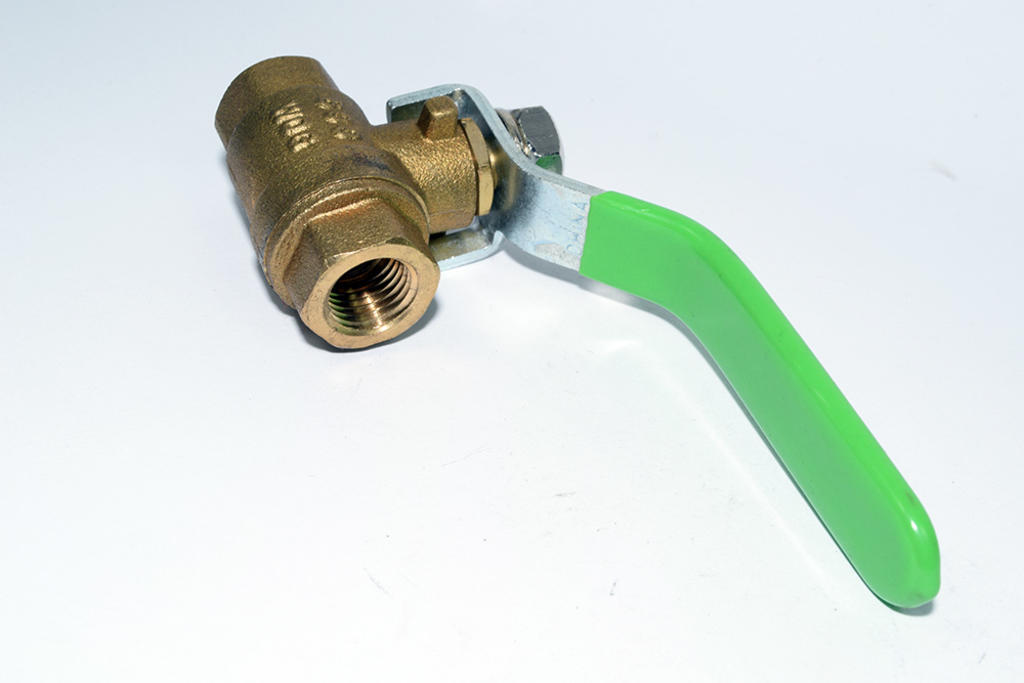
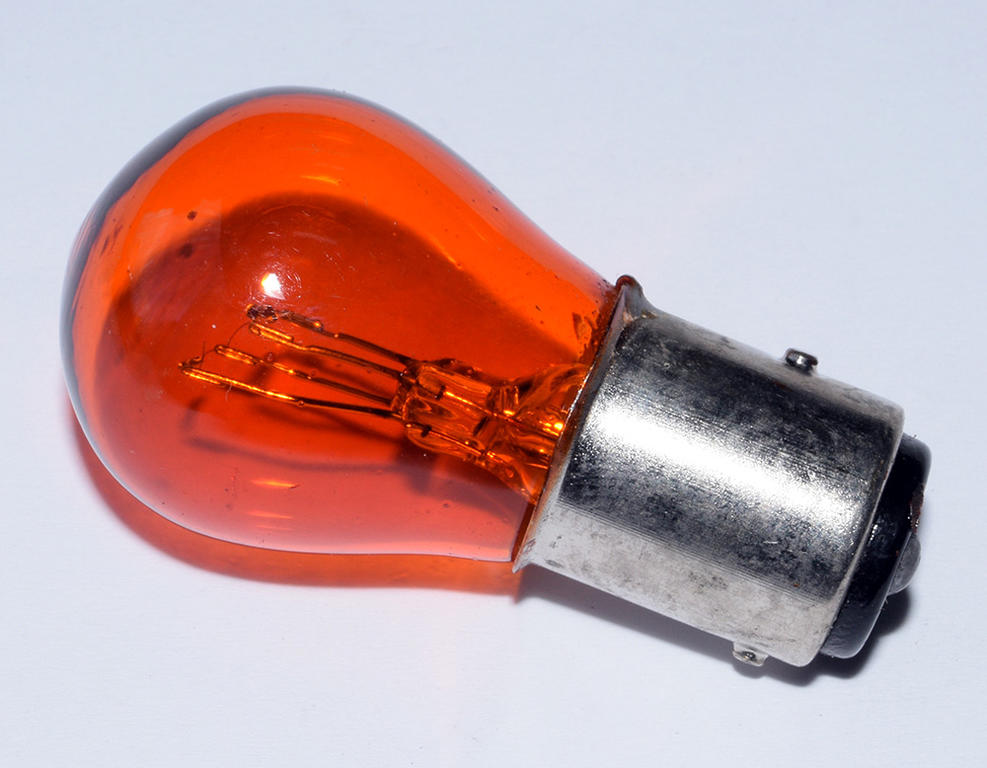
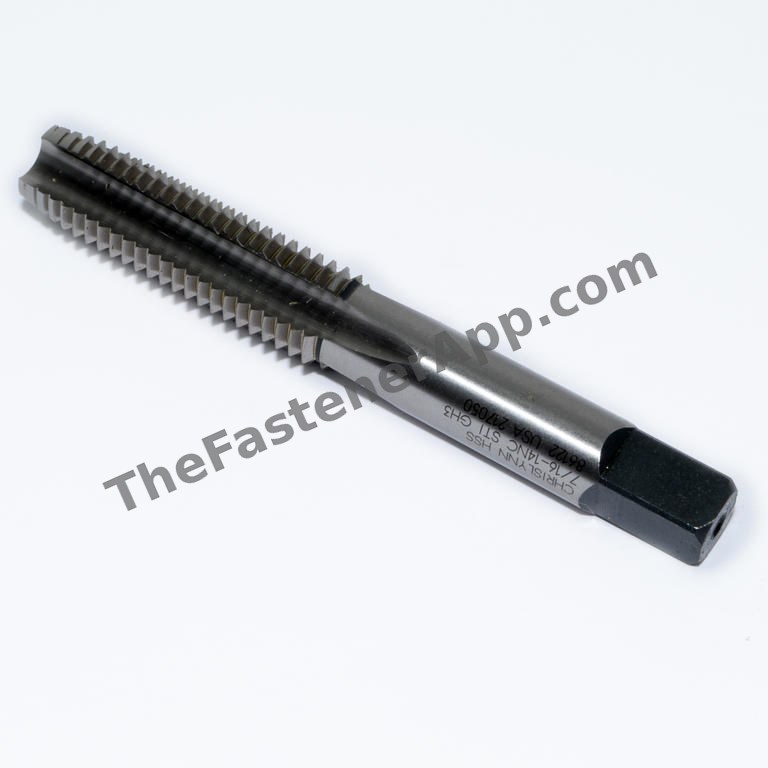
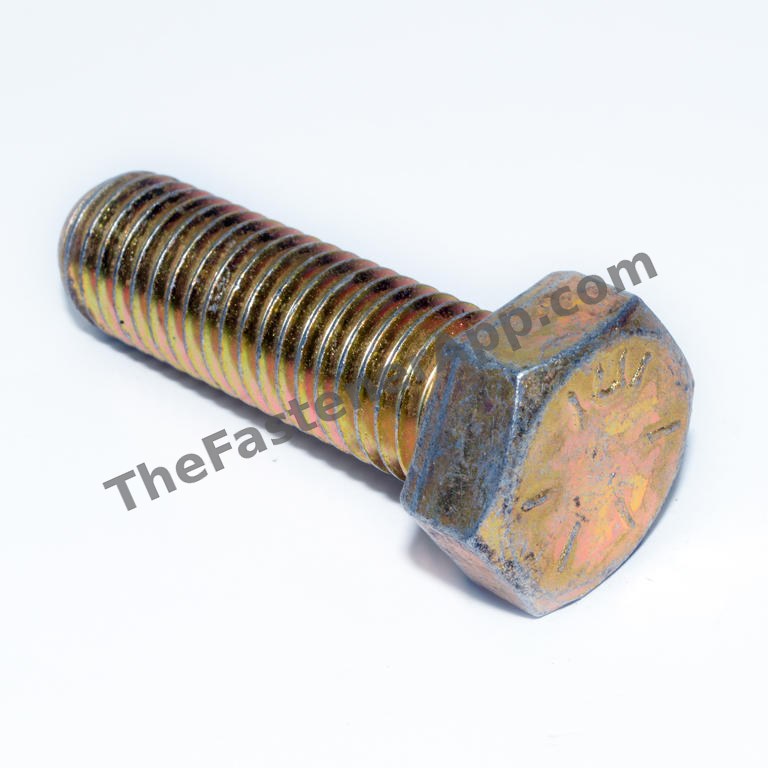
Nearly 3,000 real product photographs, covering more than 27,000 SKUs.

We had a professional photographer come in and spend weeks in our warehouse, photographing and producing real, high-resolution photos of many of our products. This work is ongoing, and many more products will be added. Right now the photographs cover more than 27,000 SKUs. We also have AI image generation capabilities.

Not ready yet? Send yourself the details.

Leave your email and we will send you what your own store would look like, what it costs, and what we would need from your system. No call unless you ask for one.

Or call 904-422-1273. We never sell or share your details.